Analytics & Insights
Monitor your webhook performance, delivery rates, and health metrics with Relae's analytics dashboard.
Analytics are available on Scale and Enterprise tiers. Upgrade your plan →
Accessing Analytics
- Log in to your dashboard
- Click the Analytics tab
- Select your time range (7 days, 30 days, or 90 days)

Overview Metrics
Key Performance Indicators (KPIs)
The dashboard displays four main KPIs at the top:
1. Total Events
The total number of webhook events processed during the selected time period.
What it shows:
- Overall webhook volume
- Traffic patterns over time
- Growth trends
How to use it:
- Monitor for unexpected spikes or drops
- Plan capacity based on growth trends
- Identify peak traffic periods
Trend indicator:
- 🟢 Green arrow: Increase from previous period
- 🔴 Red arrow: Decrease from previous period
- Percentage shows change magnitude
2. Success Rate
Percentage of webhooks successfully delivered on the first attempt (without retries).
Formula: (Successfully Delivered / Total Events) × 100
What it shows:
- Overall system health
- Destination endpoint reliability
- Integration quality
Healthy ranges:
- ✅ 95-100%: Excellent - your endpoints are reliable
- ⚠️ 85-95%: Good - some issues but manageable
- ❌ Below 85%: Needs attention - investigate failures
How to improve:
- Check Dead Letter Queue for failure reasons
- Optimize webhook handlers (return 200 faster)
- Fix endpoint authentication issues
- Review destination URL configurations
3. Failure Rate
Percentage of webhooks that failed all retry attempts and moved to the Dead Letter Queue.
Formula: (Failed Events / Total Events) × 100
What it shows:
- Events that exhausted all 5 retries
- Persistent integration issues
- Events requiring manual intervention
Target: Keep below 1%
Common causes:
- Destination endpoint down for extended periods
- Invalid destination URLs
- SSL certificate issues
- Firewall blocking Relae IPs
- Authentication failures
4. Average Response Time
Average time your destination endpoint takes to respond to webhooks.
What it shows:
- Endpoint performance
- Potential bottlenecks
- Processing efficiency
Response time ranges:
- ✅ < 1 second: Excellent
- ⚠️ 1-5 seconds: Acceptable
- ❌ > 5 seconds: Slow - may cause timeouts
Return 200 OK immediately and process webhooks asynchronously to keep response times low.
Current Billing Period Usage
Track your event consumption against your plan limits:
Current Billing Period
Jan 1, 2024 - Jan 31, 2024

125,430 events processed
What it shows:
- Events used in current billing cycle
- Billing period start and end dates
- Progress toward plan limits
Plan limits:
- Launch: 100,000 events/month
- Scale: 500,000 events/month
- Enterprise: Unlimited
Overage charges:
- Launch: $0.00015 per additional event
- Scale: $0.0001 per additional event
- Enterprise: Custom pricing
If you're consistently near your limit:
- Review event volume trends
- Consider upgrading to the next tier
- Check for duplicate or unnecessary webhooks
Event Volume Chart
Interactive line chart showing webhook volume over time.
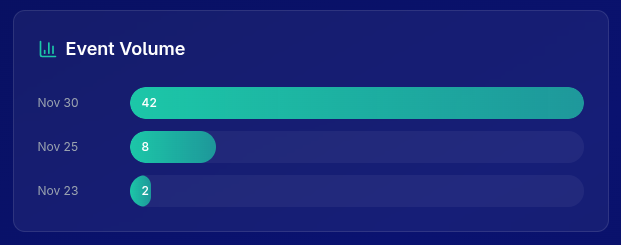
Understanding the Chart
X-axis: Time period (days or hours) Y-axis: Number of events
Features:
- Hover over data points to see exact counts
- Identify traffic patterns and spikes
- Compare different time periods
What to look for:
- Steady growth: Healthy business expansion
- Sudden spikes: Marketing campaigns, sales events, or potential issues
- Sudden drops: Possible integration problems
- Cyclical patterns: Normal daily/weekly traffic variations
Use Cases
Capacity Planning:
Notice consistent 20% monthly growth?
→ Plan to upgrade tier before hitting limits
Incident Detection:
Sudden 90% drop in events?
→ Check if vendor integration is broken
Campaign Impact:
Spike during Black Friday?
→ Verify infrastructure can handle peak loads
Source Breakdown
Pie chart showing distribution of events by vendor source.
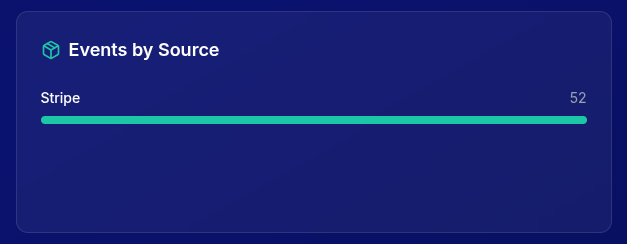
Understanding Sources
Each slice represents a different vendor/source:
- Stripe: Payment webhooks
- Shopify: Order and inventory webhooks
- GitHub: Repository and deployment webhooks
- Custom: Your custom integrations
Metrics per Source
- Total events from this source
- Percentage of overall traffic
- Color-coded for easy identification
Use Cases
Integration Health:
Stripe: 45,000 events (45%)
Shopify: 35,000 events (35%)
GitHub: 20,000 events (20%)

→ All integrations active and balanced
Detect Missing Events:
Normally: Stripe 40%, Shopify 40%, GitHub 20%
Today: Stripe 80%, Shopify 0%, GitHub 20%

→ Shopify integration may be broken
Resource Allocation:
One vendor sending 80% of events?
→ Consider dedicated destination for performance
Status Breakdown
Visualize webhook outcomes: delivered, failed, pending.

Status Types
Delivered ✅
Webhooks successfully forwarded and acknowledged by your endpoint (HTTP 2xx response).
Ideal percentage: 95-100%
Failed ❌
Webhooks that exhausted all 5 retry attempts and moved to Dead Letter Queue.
Target: < 1%
Action required: Check DLQ for failure reasons
Pending ⏳
Webhooks currently being processed or in retry queue.
Normal: < 5% Concerning: > 10% (indicates endpoint issues)
Health Check
Healthy System:
✅ Delivered: 98%
⏳ Pending: 1.5%
❌ Failed: 0.5%
Needs Attention:
✅ Delivered: 85%
⏳ Pending: 10%
❌ Failed: 5%

→ Investigate destination endpoint
→ Check Dead Letter Queue
→ Review error logs
Critical Issues:
✅ Delivered: 60%
⏳ Pending: 5%
❌ Failed: 35%

→ Destination likely down
→ Check firewall rules
→ Verify SSL certificates
→ Contact support if needed
Recent Activity
Real-time feed of the latest webhook events across all sources.
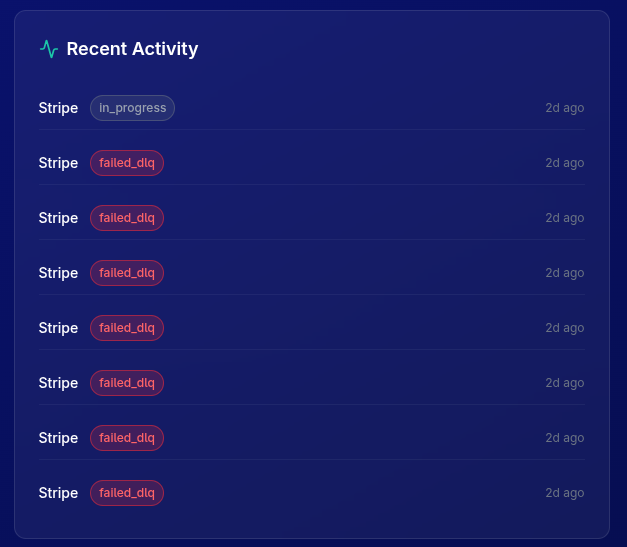
Event Information
Each row shows:
- Source: Vendor that sent the webhook
- Status: Delivered, failed, or pending
- Timestamp: When the event was processed
- Event ID: Unique identifier (click to view details)
Status Indicators
- 🟢 Delivered: Successfully forwarded
- 🔴 Failed: All retries exhausted
- 🟡 Pending: Currently being retried
Use Cases
Quick Health Check: Scan recent activity to ensure everything is flowing normally.
Debugging:
1. See failed event in recent activity
2. Note the event ID and source
3. Go to Dead Letter Queue
4. Search for event ID
5. Review failure reason
Monitoring Deployments:
Deploy new code at 2:00 PM
→ Watch recent activity for failures
→ If issues appear, rollback immediately
Time Range Selection
Choose your analysis period: 7 days, 30 days, or 90 days.
When to Use Each Range
7 Days - Short-term Analysis
Best for:
- Daily operations monitoring
- Recent deployment impact
- Quick troubleshooting
- Immediate trend detection
Use when:
- Investigating recent issues
- Validating fixes
- Monitoring new integrations
30 Days - Monthly Performance
Best for:
- Monthly reporting
- Billing period review
- Medium-term trends
- Vendor comparison
Use when:
- Preparing monthly reports
- Comparing to previous month
- Planning capacity
- Reviewing vendor health
90 Days - Long-term Trends
Best for:
- Quarterly analysis
- Growth planning
- Seasonal patterns
- Long-term health
Use when:
- Strategic planning
- Budget forecasting
- Identifying long-term issues
- Annual reviews
Trend Comparison
Each KPI shows percentage change from the previous period.
Understanding Trends
Example:
Total Events: 125,430
↗ +15.3%

This means:
- Current period: 125,430 events
- Previous period: ~108,730 events
- Growth: +15.3%
Trend Indicators
🟢 Positive Trends (Green)
- Total Events increasing
- Success Rate increasing
- Response Time decreasing
🔴 Negative Trends (Red)
- Failure Rate increasing
- Success Rate decreasing
- Response Time increasing
What Trends Mean
Total Events ↗ +20%
- ✅ Business growth
- ✅ Successful marketing
- ⚠️ May need tier upgrade soon
Success Rate ↘ -10%
- ⚠️ Integration issues
- ⚠️ Endpoint problems
- ❌ Needs immediate investigation
Failure Rate ↗ +50%
- ❌ Critical issue
- ❌ Check destination endpoints
- ❌ Review recent deployments
Response Time ↗ +30%
- ⚠️ Endpoint slowing down
- ⚠️ Database bottleneck
- ⚠️ Consider optimization
Practical Use Cases
1. Daily Health Check (5 minutes)
Morning routine:
1. Check Analytics tab
2. Verify Success Rate > 95%
3. Scan Recent Activity for errors
4. Review any failed events in DLQ
2. Weekly Performance Review
Every Monday:
1. Set time range to 7 days
2. Compare metrics to previous week
3. Identify any anomalies
4. Address issues in priority order
5. Document findings
3. Monthly Capacity Planning
End of each month:
1. Set time range to 30 days
2. Check current billing period usage
3. Calculate growth rate
4. Predict next month's volume
5. Upgrade tier if needed
4. Incident Investigation
When issues arise:
1. Go to Analytics tab
2. Look for sudden changes in metrics
3. Check Recent Activity for patterns
4. Identify affected source
5. Review DLQ for error details
6. Fix root cause
7. Monitor recovery
5. Integration Audit
Quarterly review:
1. Set time range to 90 days
2. Review Source Breakdown
3. Verify all sources are active
4. Check each source's success rate
5. Identify underperforming integrations
6. Optimize or fix issues
Performance Optimization Tips
Improve Success Rate
Target: 95%+
-
Return 200 quickly
app.post("/webhook", async (req, res) => {
  // Return 200 immediately
  res.status(200).send("OK");

  // Process asynchronously
  processWebhookAsync(req.body);
}); -
Add proper error handling
try {
  await processWebhook(data);
} catch (error) {
  // Log but don't throw
  logger.error("Webhook processing failed", error);
  // Webhook still acknowledged successfully
} -
Monitor endpoint health
- Set up uptime monitoring (Pingdom, UptimeRobot)
- Alert on endpoint downtime
- Implement health check endpoint
Reduce Response Time
Target: < 1 second
-
Process asynchronously
- Acknowledge immediately
- Queue for background processing
- Use job workers (Bull, Sidekiq)
-
Optimize database queries
- Add indexes on frequently queried fields
- Use database connection pooling
- Cache frequently accessed data
-
Minimize external API calls
- Batch operations when possible
- Use async/non-blocking calls
- Implement circuit breakers
Reduce Failure Rate
Target: < 1%
-
Fix common issues
- Update invalid destination URLs
- Renew SSL certificates
- Fix authentication problems
-
Handle edge cases
- Validate payload structure
- Handle missing fields gracefully
- Add retry logic for transient errors
-
Monitor and alert
- Set up alerts for high failure rates
- Review DLQ daily
- Investigate failure patterns
Alerts & Notifications
Automated alerts for anomalies and threshold breaches are coming soon to Enterprise tier.
For now, manually monitor these metrics:
- Success rate drops below 90%
- Failure rate exceeds 5%
- Response time exceeds 5 seconds
- Event volume deviates by 50%
Exporting Data
Current Options
Screenshot: Use browser tools to capture charts
Manual export: Copy data from tables and charts
API Access (Enterprise)
Contact support for API access to analytics data for:
- Custom reporting
- Integration with BI tools
- Automated monitoring
- Historical analysis
Troubleshooting
Analytics Not Loading
Possible causes:
- Browser JavaScript disabled
- Ad blocker interference
- Network connectivity issues
Solutions:
- Refresh the page
- Disable ad blockers for relaehook.com
- Try different browser
- Contact support if persistent
Data Seems Incorrect
Possible causes:
- Caching delay (data updates every few minutes)
- Time zone differences
- Recently changed destinations
Solutions:
- Wait 5 minutes and refresh
- Check time range selection
- Verify correct account selected
- Contact support with specifics
Missing Events
Check:
- Events within retention period for your tier
- Correct time range selected
- Source/destination properly configured
- Vendor actually sending webhooks
Best Practices
- ✅ Check analytics daily - Make it part of your routine
- ✅ Set baseline metrics - Know what's normal for your traffic
- ✅ Investigate deviations - Don't ignore unusual patterns
- ✅ Document incidents - Track what went wrong and how you fixed it
- ✅ Review trends weekly - Catch issues before they become critical
- ✅ Plan capacity proactively - Upgrade before hitting limits
- ✅ Share with team - Keep stakeholders informed of webhook health
Upgrading for Analytics
Currently on Builder or Launch tier?
Unlock Analytics
Scale Tier ($65/month):
- 500,000 events/month
- 30 days retention
- Full analytics dashboard
- Priority support
Benefits:
- Identify issues faster
- Optimize performance
- Plan capacity accurately
- Reduce downtime
- Better understand traffic patterns
Next Steps
Need Help?
- 📧 Email: support@relaehook.com
- 💬 Questions about metrics or analytics
- 📊 Custom reporting needs (Enterprise)
- 🐛 Report issues on GitHub