Managing Webhooks
Learn how to view, search, filter, and manage your webhook events in the Relae dashboard.
Accessing the Webhooks Dashboard
- Log in to relaehook.com/dashboard
- Click the "Webhooks" tab
This view shows all successfully delivered webhook events.
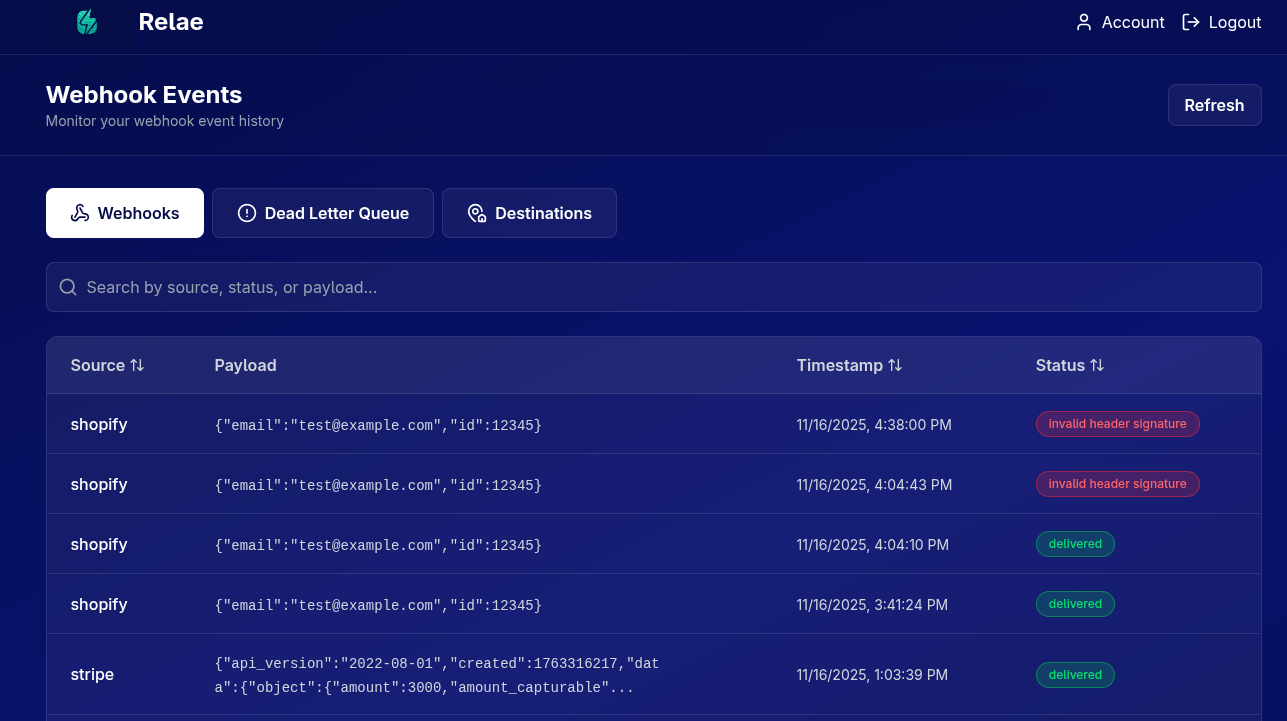
Understanding the Webhooks Table
Each webhook event displays:
| Column | Description |
|---|---|
| Source | The vendor that sent the webhook (e.g., stripe, shopify) |
| Payload | Preview of the webhook data (first 100 characters) |
| Timestamp | When the webhook was received by Relae |
| Status | Current delivery status (delivered, pending, failed) |
Viewing Webhook Details
Click on any webhook row to open the details modal:
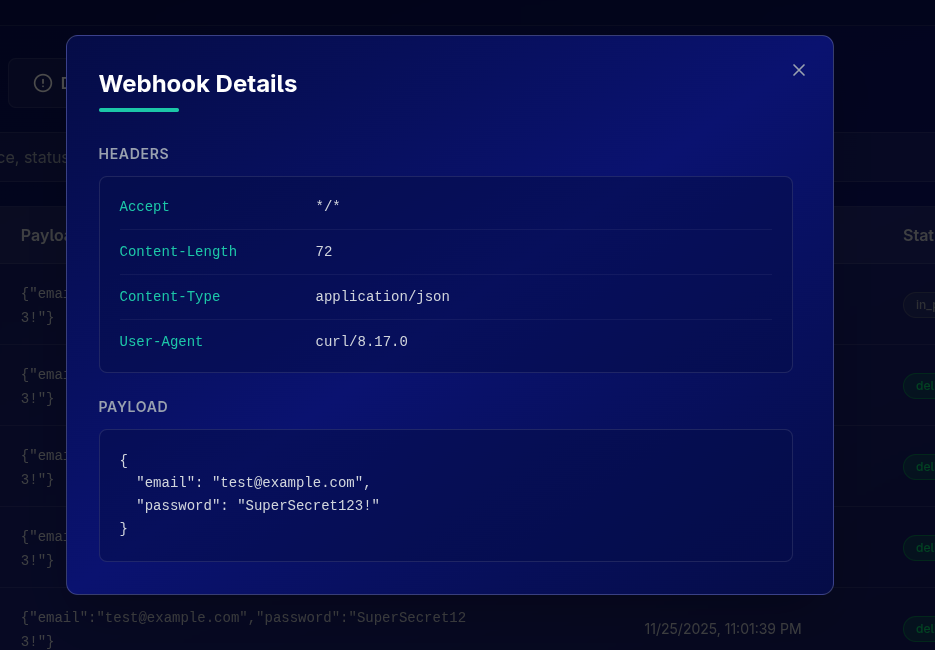
What You'll See
Headers Section
All HTTP headers received with the webhook:
{
  "content-type": "application/json",
  "x-stripe-signature": "t=1701234567,v1=abc123...",
  "user-agent": "Stripe/1.0",
  "x-relae-source": "stripe"
}
Payload Section
The complete webhook body in formatted JSON:
{
  "id": "evt_1234567890",
  "object": "event",
  "type": "payment_intent.succeeded",
  "data": {
    "object": {
      "id": "pi_1234567890",
      "amount": 5000,
      "currency": "usd",
      "status": "succeeded"
    }
  }
}
Click anywhere outside the modal or press ESC to close it.
Searching & Filtering
Search Bar
Use the search bar to find specific webhooks:
Search by source, status, or payload...
Examples:
stripe- Find all Stripe webhookspayment_intent- Find webhooks containing "payment_intent"delivered- Filter by statusevt_12345- Search by event ID in payload
The search is case-insensitive and searches across:
- Source name
- Status
- Entire payload (JSON)
Sorting
Click any column header to sort:
- Source: Alphabetically (A-Z or Z-A)
- Timestamp: Chronologically (newest first or oldest first)
- Status: By delivery status
The current sort field and direction are indicated by the arrow icon.
Pagination
By default, 10 webhooks are shown per page. Use the pagination controls at the bottom:
- ← Previous: Go to previous page
- Next →: Go to next page
- Page X of Y: Shows current position
Webhook Statuses
Delivered ✅
The webhook was successfully forwarded to your destination and your application returned a 2xx status code.
Pending ⏳
The webhook is currently being processed or retried. This is temporary.
Failed ❌
The webhook failed after all retry attempts and has been moved to the Dead Letter Queue.
Refresh Data
Click the "Refresh" button in the top right to reload the latest webhook events.
The dashboard automatically refreshes every 30 seconds when you're actively viewing it.
Filtering by Time Period
While there's no date picker UI, you can use the search to filter by approximate timeframe:
- Note the timestamps in the table
- Use pagination to navigate to earlier events
- Events are ordered by most recent first
Understanding Webhook Flow
Best Practices
1. Regular Monitoring
Check your webhook dashboard daily to ensure:
- Events are being received
- Success rate is high (>99%)
- No unexpected sources
2. Investigate Failed Events
If you see events with "failed" status:
- Click to view details
- Check the error message
- Verify your destination URL is correct
- Review your application logs
3. Use Search Effectively
Save time by using specific search terms:
- Search by event type:
payment_intent.succeeded - Search by customer:
cus_1234567890 - Search by amount:
5000(if amounts are in payload)
4. Export Important Events
If you need to keep webhooks beyond your retention period:
- Click on the event to view details
- Copy the full payload
- Save to your own systems
Events are automatically deleted after your tier's retention period:
- Builder: 7 days
- Launch: 14 days
- Scale: 30 days
- Enterprise: Custom
Plan accordingly and export critical data.
Common Tasks
Finding a Specific Payment
1. Go to Webhooks tab
2. Search for: payment_intent or invoice
3. Look for specific ID in payload preview
4. Click to view full details
Checking Recent Activity
1. Go to Webhooks tab
2. Sort by Timestamp (newest first)
3. Review recent events
4. Click Refresh to update
Verifying Delivery
1. Note the timestamp from your vendor
2. Search for that event in Relae
3. Check status is "delivered"
4. Verify in your application logs
Debugging an Integration
1. Send test webhook from vendor
2. Wait a few seconds
3. Refresh Relae dashboard
4. Find the test event
5. Click to view full payload and headers
6. Compare with vendor documentation
Understanding the UI
Color Coding
- Green badges: Successful delivery
- Yellow badges: Pending or in progress
- Red badges: Failed or error state
- Gray text: Metadata and secondary info
Icons
- 🔍 Search: Find specific events
- 🔄 Refresh: Reload latest data
- 📋 Details: View full webhook data
- ⏰ Timestamp: When event was received
Performance Tips
For Large Event Volumes
If you have thousands of events:
- Use search instead of scrolling through pages
- Be specific with search terms to reduce results
- Upgrade tier for longer retention if needed
- Export regularly if you need historical data
Optimizing Your View
- Sort by timestamp to see newest first
- Use search to filter to relevant sources only
- Focus on failed events (in DLQ) for troubleshooting
- Check Analytics tab (Scale+) for aggregate metrics
Troubleshooting
Events Not Appearing
Check:
- Vendor is sending to correct Relae endpoint
- Webhook signature is valid (if configured)
- You're looking at Webhooks tab (not DLQ)
- Search/filter isn't hiding results
Can't Find Specific Event
Try:
- Clear search bar
- Sort by timestamp (newest first)
- Navigate through pages
- Check DLQ tab (it might have failed)
- Verify event was actually sent by vendor
Status Shows "Pending" for Too Long
This means:
- Event is still being retried
- Your destination might be slow to respond
- Check your application logs for issues
After 5 failed retries, it will move to DLQ.
Next Steps
- Learn about the Dead Letter Queue →
- View Analytics (Scale tier) →
- Understand Retry Logic →
- Verify Signatures →
Need Help?
Can't find what you're looking for?
- 📧 Email: support@relaehook.com
- 📖 Check the FAQ
- 💬 Share feedback via the dashboard